Oil Tops $93 (Briefly $95) as Iran Strikes Enter 11th Day, Dow Ticks Higher Into Alphabet & Tesla Earnings, Gold Hits Two-Week High | U.S. Session – Technical Analysis | 22 July 2026
Oil Tops $93 and Briefly Hits $95 as Iran Strikes Enter an 11th Day, Dow Ticks Higher Into Alphabet & Tesla Earnings
USD/CHF · USD/CAD · Gold · Brent Crude Oil · Dow Jones · US 05Y · BTC/USD · Litecoin — live U.S. morning coverage through the New York open
“Eleven days into strikes on Iran and with a Black Sea pipeline now hit too, the oil shock has stopped being a Middle East story and become a global inflation story — yet equities are shrugging it off for now, with the Dow actually ticking higher into tonight’s Alphabet and Tesla numbers.”
U.S. trade on Wednesday is dominated by the collision between a widening energy shock and a fast-approaching Federal Reserve decision. Eleven straight days of U.S. strikes on Iranian targets, Secretary of State Marco Rubio’s comment that Iran is “not serious about talks,” and a fresh attack on the Caspian Pipeline Consortium’s Black Sea terminal have pushed Brent above $93 a barrel — briefly topping $95 intraday — and reopened the debate over how much further the energy-driven inflation shock can run. With the FOMC now in its pre-meeting blackout period ahead of 28-29 July, the 5-year Treasury yield is pressing toward multi-month highs as traders price meaningfully higher odds of a later hike rather than the cuts that were the base case only months ago.
Equities are holding up better than the oil shock alone would suggest: the Dow Jones has turned higher, up modestly on the session, while the S&P 500 hovers near the flatline and the Nasdaq Composite gives back a little ground as investors brace for Alphabet and Tesla earnings after the bell. Commodities are broadly bid on the same safe-haven and inflation-hedge impulse, with Gold at a fresh two-week high and Silver holding above $59.50, while the oil-linked Canadian Dollar is one of the session’s stronger performers against a broadly firm Greenback. Crypto assets are more measured, easing back from Tuesday’s strength as risk appetite cools into next week’s policy decision.
U.S. Session News Flow
The stories moving USD/CHF, USD/CAD, Gold, Brent Crude, the Dow, the US 5-year yield and crypto this morning
U.S. Session Economic Calendar — 22 July 2026
Key releases and events shaping price action through the New York morning (ET unless noted)
| Time | Event | Forecast / Detail | Impact | Market Read |
|---|---|---|---|---|
| 🇺🇸Ongoing | US Strikes on Iran Enter 11th Day / Black Sea Pipeline Hit | Trump dismisses near-term talks, flags possible Pickaxe Mountain strike; CPC terminal attacked | 🔴 CRITICAL | Primary driver of the risk premium across oil, gold, Treasury yields and the Dollar this morning |
| 🇺🇸Blackout | FOMC Pre-Meeting Blackout Period (Decision 28-29 July) | Fed officials keep a further move live; markets price roughly 68% odds of a September hike | 🔴 CRITICAL | Key driver behind the US 5-year yield’s push higher and the broadly firm Dollar tone |
| 🇺🇸After Close | Alphabet & Tesla Q2 Earnings | Markets look for proof of AI-spend payoff from Alphabet and margin resilience from Tesla | 🔴 CRITICAL | Decisive swing factor for the Dow and broader risk sentiment into Thursday’s session |
| 🇨🇦Recent | Bank of Canada Holds at 2.25%, Hawkish Tone | BoC flags stronger medium-term growth and inflation running above prior forecasts | 🟢 MEDIUM | Key driver of the Loonie’s resilience and the USD/CAD trade idea |
| 🇺🇸Ongoing | US Tariff Headlines on Canada | Fresh tariff commentary lingers alongside otherwise supportive oil-driven CAD flows | 🟢 MEDIUM | Partial offset to Loonie strength; a swing factor if trade rhetoric escalates further |
| 🇺🇸This Week | EIA Weekly Crude Inventories | Traders watching for confirmation of tightening supply amid the Hormuz/Black Sea risk premium | 🟢 MEDIUM | Key fundamental input for the Brent Crude Oil trade idea alongside the geopolitical backdrop |
| 🇺🇸Thursday | US Initial Jobless Claims (Preview) | Labour market expected to stay resilient, complicating the case for near-term Fed cuts | 🟢 MEDIUM | Background driver for Dollar tone and a swing factor for USD/CHF and the US 5-year yield |
| 🇺🇸Next Week | FOMC Policy Decision (28-29 July) | Markets assessing Fed odds amid oil-driven inflation risk and a resilient labour market | 🟢 MEDIUM | The decisive event for Treasury yields, the Dollar and broader risk sentiment into month-end |
U.S. Session Trade Ideas
Technical setups and fundamental context across the session’s eight key instruments
USD/CHF

Fundamental Backdrop
USD/CHF is holding steady near 0.8127 as two classic safe-haven currencies pull against each other: the Dollar is broadly firm on the same Middle East-driven flight-to-quality bid lifting Treasury yields, while the Franc typically draws its own safe-haven demand whenever geopolitical risk escalates. That tug-of-war has kept the pair confined to a roughly 0.80-0.813 band since mid-June, with neither side able to establish a clear trend.
Technical Outlook
The pair remains inside a well-worn range between roughly 0.8045 and 0.8165 that has held for over a month. A sustained break above 0.8165 would expose the 0.8210 area, while a close back below 0.8045, this trade’s stop-loss level, would open the way toward the lower end of the range near 0.7985.
Session Catalysts
Watch for: (1) further escalation or de-escalation headlines from the US-Iran conflict and their impact on broad Dollar and Franc safe-haven flows; (2) any pre-meeting commentary from Fed officials during the FOMC blackout period; (3) US Treasury yield direction as a proxy for Dollar strength; (4) Swiss National Bank commentary on Franc strength; (5) US jobless claims data due Thursday.
Trade USD/CHF and 55+ FX pairs on our Zero Account‘s 0.0 Pips Spreads — Open an Account at Capital Street FX.
USD/CAD

Fundamental Backdrop
USD/CAD is slipping toward 1.4086 as the Canadian Dollar draws support from its role as a net-oil-exporter currency, with Brent’s push above $92 acting as a direct tailwind for the Loonie. The Bank of Canada’s recent hold at 2.25% alongside a relatively hawkish tone, flagging stronger medium-term growth and inflation running above prior forecasts, reinforces the case for CAD resilience even as fresh U.S. tariff headlines on Canada remain a lingering headwind.
Technical Outlook
The pair has pulled back from a recent test of the 1.4160 area and now trades back inside its broader July range between roughly 1.3980 and 1.4210. A sustained break below 1.3980 would expose the lower end of the multi-month range, while a close back above 1.4210, this trade’s stop-loss level, would call the bearish setup into question and open the way toward 1.4280.
Session Catalysts
Watch for: (1) further oil-price direction tied to the US-Iran conflict and Black Sea pipeline disruption; (2) fresh U.S.-Canada tariff or trade headlines; (3) broad US Dollar tone into the FOMC blackout period; (4) Canadian data releases during the session; (5) US Treasury yield direction relative to Canadian yields.
Trade USD/CAD and 55+ FX pairs on our Zero Account‘s 0.0 Pips Spreads — Open an Account at Capital Street FX.
Gold

Fundamental Backdrop
Gold is holding a strong bid near $4,151, a fresh two-week high, as the widening Middle East energy shock drives safe-haven demand into precious metals ahead of next week’s Fed decision. Silver has extended its own advance to trade above $59.50, underscoring how broad-based the inflation-hedge and safe-haven bid has become across the metals complex. That said, Gold remains roughly 26% below January’s record high near $5,598, reflecting a choppier medium-term backdrop even as today’s tone is firmly bullish.
Technical Outlook
The metal is testing the upper end of its recent consolidation range, with a sustained break above $4,180 exposing the $4,220 target and, on further strength, the $4,300 region. On the downside, a close back below $4,020, this trade’s stop-loss level, would call the near-term bullish setup into question and open the way toward $3,950.
Session Catalysts
Watch for: (1) further escalation or de-escalation headlines from the US-Iran conflict; (2) US Treasury yield direction, given Gold’s inverse sensitivity to real rates; (3) Fed commentary during the blackout period ahead of 28-29 July; (4) broad US Dollar tone; (5) Silver’s price action as a read on broader precious-metals momentum.
Trade Gold and a full suite of metals on our Zero Account‘s 0.0 Pips Spreads — Open an Account at Capital Street FX.
Brent Crude Oil

Fundamental Backdrop
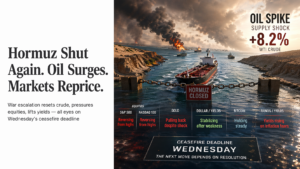
Brent crude is trading near $93.50, briefly touching $95 intraday, after the U.S. military carried out an eleventh consecutive day of strikes against Iranian targets aimed at reducing Tehran’s ability to threaten shipping through the Strait of Hormuz, which remains open. Secretary of State Marco Rubio said Iran is “not serious about talks,” while President Trump has floated possible strikes on the suspected Pickaxe Mountain nuclear facility, and supply risk has now spread beyond the Middle East after a fresh attack on the Caspian Pipeline Consortium’s Black Sea terminal, a key export route for Kazakh crude.
Technical Outlook
The four-day rally has carried price to its highest intraday level in over a month, with today’s brief push through $95 already exposing this trade’s $95.50 target and, further out, the $100 psychological level that OCBC has flagged as achievable in a larger escalation scenario. On the downside, a close back below $88.50, this trade’s stop-loss level, would call the breakout into question and open the way toward $85.00.
Session Catalysts
Watch for: (1) further strikes or ceasefire signals in the US-Iran conflict; (2) any escalation around the Caspian Pipeline Consortium terminal or other Black Sea infrastructure; (3) weekly EIA crude inventory data; (4) OPEC+ commentary on spare capacity; (5) broad US Dollar tone, given oil’s inverse sensitivity to Dollar strength.
Trade Brent Crude Oil and a full suite of energy markets on our Zero Account‘s 0.0 Pips Spreads — Open an Account at Capital Street FX.
Dow Jones

Fundamental Backdrop
The Dow Jones is consolidating near 52,180, pulling back modestly after Tuesday’s 385-point, 0.74% rally to 52,224.64, as chip-stock momentum fades and investors position defensively ahead of Alphabet and Tesla earnings due after today’s close. The broader earnings season backdrop remains supportive, with nearly 88% of the roughly 66 S&P 500 companies that have reported so far topping bottom-line estimates, per FactSet, even as rising oil prices complicate the inflation outlook.
Technical Outlook
The index remains within a short-term consolidation just below Tuesday’s closing high, with a sustained break above 52,850 exposing fresh record territory. On the downside, a close back below 51,150, this trade’s stop-loss level, would open the way toward the 50,600 area, the lower bound of the recent range.
Session Catalysts
Watch for: (1) Alphabet and Tesla earnings after today’s close, and their read-through for the broader AI trade; (2) oil-price direction tied to the US-Iran conflict; (3) US Treasury yield moves as a discount-rate signal for equities; (4) any pre-meeting Fed commentary during the blackout period; (5) continued earnings-season results from other S&P 500 constituents.
Trade the Dow Jones and major global indices on our Zero Account‘s 0.0 Pips Spreads — Open an Account at Capital Street FX.
US 05Y

Fundamental Backdrop
The US 5-year Treasury yield is pressing toward 4.40%, close to its firmest level in months, as the oil-driven inflation shock complicates the Fed’s calculus just as the FOMC enters its customary blackout period ahead of the 28-29 July meeting. Fed officials have repeatedly stressed that inflation remains a key concern, and traders are now assigning roughly a 68% probability to a rate increase as soon as September — a sharp reversal from the rate-cut expectations that dominated earlier in the year.
Technical Outlook
The yield has broken decisively higher from its spring lows near 3.75-3.95%, and a sustained push above 4.45% would expose this trade’s 4.55% target and, further out, the 4.70% region last tested in 2025. On the downside, a drop back below 4.18%, this trade’s stop-loss level, would call the bullish setup into question and reopen the case for a return toward 4.00%.
Session Catalysts
Watch for: (1) further escalation or de-escalation headlines from the US-Iran conflict and their impact on oil-driven inflation expectations; (2) any commentary from Fed officials before the blackout period tightens further; (3) US jobless claims data due Thursday; (4) next week’s 28-29 July FOMC decision itself; (5) broad Dollar and equity-market tone as a cross-check on the rates narrative.
Trade U.S. rates-linked instruments and a full suite of global markets on our Zero Account‘s 0.0 Pips Spreads — Open an Account at Capital Street FX.
BTC/USD

Fundamental Backdrop
Bitcoin is trading near $65,850, giving back part of Tuesday’s push to a five-week high above $66,540, as broader risk appetite cools into next week’s FOMC decision. The asset remains well off its 52-week intraday high of $126,198 from October 2025, and analysts remain split on the second-half outlook: Standard Chartered has renewed a $100,000 year-end target, while prediction markets favour a more modest close between $70,000 and $75,000.
Technical Outlook
Price is consolidating just below the five-week high after a strong recovery from the low-$60,000s, with a sustained break above $68,500 exposing the $72,000 area. On the downside, a close back below $62,800, this trade’s stop-loss level, would call the recovery attempt into question and reopen the case for a retest of the low-$60,000s.
Session Catalysts
Watch for: (1) broad risk sentiment into next week’s FOMC decision; (2) US equity-market direction, particularly around today’s Alphabet and Tesla earnings; (3) spot Bitcoin ETF flow data; (4) US Treasury yield moves as a cross-asset risk signal; (5) any fresh regulatory or institutional-adoption headlines.
Trade BTC/USD and a full suite of digital assets on our Zero Account‘s 0.0 Pips Spreads — Open an Account at Capital Street FX.
Litecoin

Fundamental Backdrop
Litecoin is holding near $46.80, consolidating in the mid-$40s after climbing from a February low near $45.09 through a choppy first half of 2026. The asset continues to benefit on the margin from expanding institutional custody infrastructure and rising on-chain network activity, though it remains sensitive to the same broader risk-off impulse currently weighing on Bitcoin ahead of next week’s Fed decision.
Technical Outlook
Price is consolidating in a $43-$50 range that has held for several weeks, with a sustained break above $50.00 exposing the $55-$60 area that some analysts see as achievable by year-end. On the downside, a close back below $42.80, this trade’s stop-loss level, would open the way toward the low-$40s support shelf.
Session Catalysts
Watch for: (1) Bitcoin’s price direction as the dominant sentiment driver for altcoins; (2) broad risk appetite into next week’s FOMC decision; (3) any Litecoin-specific network or custody-adoption news; (4) US equity-market tone around today’s earnings; (5) overall crypto-market fear/greed positioning.
Trade Litecoin and a full suite of digital assets on our Zero Account‘s 0.0 Pips Spreads — Open an Account at Capital Street FX.
U.S. Session Frequently Asked Questions
Quick answers to the questions traders are asking about today’s key moves
U.S. Session Summary — Wednesday, 22 July 2026 (Live Update)
Wednesday’s U.S. session is dominated by the widening collision between an energy shock that has now spread beyond the Middle East and a Federal Reserve decision that has shifted from a straightforward hold into a genuine live call, with Brent crude pressing above $92 a barrel after the U.S. military carried out an eleventh consecutive day of strikes on Iranian targets and a fresh attack hit the Caspian Pipeline Consortium’s Black Sea terminal; that has pushed the US 5-year Treasury yield toward its firmest levels in months, near 4.40%, as Fed officials keep a further policy move on the table just as the FOMC enters its blackout period ahead of the 28-29 July meeting. In foreign exchange, USD/CHF holds steady near 0.8127 as two safe-haven currencies pull against each other, while USD/CAD slips toward 1.4086 as the oil-linked Loonie draws direct support from the crude rally even against lingering U.S. tariff headlines. Commodities are broadly bid on the same safe-haven and inflation-hedge impulse, with Gold near a two-week high around $4,130 and Silver up more than 5%, while equities are cautious, with the Dow Jones consolidating near 52,180 as investors brace for Alphabet and Tesla earnings after today’s close. Digital assets are more measured, with Bitcoin slipping from Tuesday’s five-week high near $66,540 to trade around $65,850, and Litecoin holding near $46.80 as broader crypto risk appetite cools into next week’s Fed decision. Highest-conviction session idea: buy the US 5-year Treasury yield on dips toward 4.30%, targeting 4.55% — the combination of a genuine, widening oil-driven inflation shock, hawkish Fed commentary and a live September hike debate is a powerful, multi-pronged tailwind for yields, though a credible Iran ceasefire breakthrough or a dovish Fed surprise are real risks that could reverse the move quickly.
For the individual instruments: USD/CHF buy dips toward 0.8080, stop 0.8045, target 0.8165 — broad Dollar firmness tied to the safe-haven bid is a genuine tailwind, though comparable Franc safe-haven demand is a real headwind. USD/CAD sell rallies toward 1.4150, stop 1.4210, target 1.3980 — the oil-linked Loonie’s strength is a genuine tailwind for the bearish case, though lingering U.S. tariff headlines on Canada are a real risk. Gold buy dips toward $4,080, stop $4,020, target $4,220 — broad safe-haven and inflation-hedge demand is a genuine tailwind, though a firmer Dollar into the Fed decision is a real headwind. Brent Crude Oil buy dips toward $90.20, stop $88.50, target $95.50 — a genuine, widening supply-risk premium is a powerful tailwind, though a credible ceasefire breakthrough is a real risk. Dow Jones buy dips toward 51,650, stop 51,150, target 52,850 — resilient early earnings-season results are a genuine tailwind, though oil-driven Fed tightening risk is a real headwind. US 05Y buy yield dips toward 4.30%, stop 4.18%, target 4.55% — the oil-driven inflation shock and hawkish Fed commentary are genuine tailwinds, though a ceasefire breakthrough or dovish Fed surprise is a real risk. BTC/USD buy dips toward $64,200, stop $62,800, target $68,500 — a strong recovery off recent lows is a genuine tailwind, though cautious risk sentiment into the Fed decision is a real headwind. Litecoin buy dips toward $44.50, stop $42.80, target $50.00 — rising institutional custody adoption is a genuine tailwind, though repeated rejection near the $50 resistance shelf is a real risk. The decisive variables for the remainder of the session are further escalation or de-escalation headlines from the US-Iran conflict, Alphabet and Tesla’s earnings results after today’s close, any pre-meeting signals from Fed officials during the blackout period, and next week’s 28-29 July FOMC meeting. Size positions accordingly, and note that the geopolitical and macro backdrop remains exceptionally fluid and carries genuine event risk that could reshape sentiment sharply intraday.
Ready to act on today’s setups? Open an Account with Capital Street FX and trade every instrument covered in this report on our Zero Account‘s 0.0 Pips Spreads and 1:10000 Leverage, across 2000+ Instruments, with a welcome deposit bonus and 24/7 Live Support on hand for every session.
Not sure which account fits your style? Compare our Account Types side by side with our Account Comparison tool, browse current Promotions / Bonus offers, and trade from our Trading Platform suite. Funding is simple via our Deposit & Withdrawal options. For ongoing coverage, explore our Forex Analysis Pages, Commodity Analysis Pages and Crypto Analysis Pages, plus our Daily Market Analysis and Weekly Market Analysis reports and the full Economic Calendar. New to trading? Visit our Trading Education / Blog, or reach our Contact Us / Live Support team any time.
Access Live U.S. Markets →