Meta Platforms (META) Market Outlook Today | Q2 Earnings Miss, AI Capex Surge & Technical Setup | 30 July 2026
Meta Platforms (META) Market Outlook Today: Technical Levels, Q2 Earnings Reaction and a Trade Setup for the Next 24 Hours
META slides toward the mid-$500s after a Q2 earnings-per-share miss overshadows a 28% revenue beat.
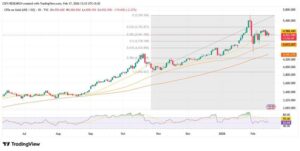
A same-day walkthrough of Meta Platforms, Inc. (NASDAQ: META) covering today’s price action, the fundamental news most likely to move the stock, the economic calendar events due in the next 24 hours — closing with a trade setup that lists entry, stop loss and take profit. META closed the regular session at 585.61, down 1.31% on the day, holding just below the 0.618 Fibonacci retracement at 586.45 while trading beneath the short-term moving-average cluster between 604.55 and 625.81, measured against the 520.50 swing low and 693.14 swing high of the broader pullback since META’s 2025 peak. The stock’s real story unfolded after the close: Meta’s second-quarter 2026 results, released once markets shut on July 29, triggered a sharp after-hours slide toward 541.60 as investors weighed a revenue beat against a much larger-than-expected earnings miss.
META enters the next 24 hours with several live storylines. Meta reported Q2 2026 revenue of 60.80 billion dollars, up 28% year-over-year and ahead of the roughly 59.5 to 60.2 billion dollar consensus, but diluted earnings per share of 6.18 dollars missed the approximately 7.13 dollar estimate, largely due to 2.4 billion dollars of legal-related charges and 1.2 billion dollars of severance costs tied to May 2026 headcount reductions. Operating margin compressed to 31% from 43% a year earlier as costs and expenses grew 55% year-over-year. Management guided Q3 2026 revenue to 61 to 64 billion dollars, slightly below Street expectations, while narrowing and raising the low end of full-year capital-expenditure guidance to 130 to 145 billion dollars from a prior 125 to 145 billion dollar range, keeping the AI spending debate front and center. The broader market backdrop stayed choppy too, with the Federal Reserve’s July 29 decision to hold rates at 3.50% to 3.75% and a 30-year Treasury yield near its highest since 2007 adding to overall volatility across risk assets this week.
Fundamental News Set to Impact META Next
The stories driving today’s move and shaping the next 24 hours for Meta Platforms
Calendar — Events That Can Move META in the Next 24 Hours
Key releases and events shaping META over the coming 24 hours (times ET unless noted)
| Date / Time | Event | Detail | Impact | Why It Matters for META |
|---|---|---|---|---|
| Thu Jul 30, pre-market | META Earnings Call Follow-Through | Continued analyst notes and price-target revisions after the Q2 call | 🔴 CRITICAL | Analyst reaction to the EPS miss and capex guidance will shape the opening gap and early direction for META shares |
| Thu Jul 30, 08:30 ET | US GDP (Q2 Advance) & June PCE Inflation | First estimate of Q2 growth; core PCE forecast near 3.4% year-over-year | 🔴 CRITICAL | A hot PCE print would revive rate-hike concerns and pressure high-multiple tech names including META; a soft print could support a rebound |
| Thu Jul 30, after close | Apple & Amazon Earnings | Two more megacap earnings reports land after Thursday’s close | 🟢 MEDIUM | Peer commentary on AI spending and consumer demand can shift sentiment across the wider tech complex, including META |
| Thu Jul 30-Fri Jul 31, all day | Oil Price Swings & Middle East Headlines | Crude price action tied to the Strait of Hormuz disruption | 🟢 MEDIUM | Broader risk sentiment remains sensitive to oil and geopolitical headlines, which can spill over into equity volatility including META |
| Fri Jul 31, all day | Month-End Rebalancing | Portfolio and index rebalancing flows into month-end | ⚪ LOW | Month-end flows can add short-term volatility to heavily weighted index names such as META |
META Trade Setup for the Next 24 Hours
Meta Platforms, Inc. — updated price, levels, and full fundamental and technical analysis
META
Technical Summary (Next 24 Hours)
META closed the regular session at 585.61, just below the 0.618 Fibonacci retracement at 586.45, measured off the decline from the 693.14 swing high to the 520.50 swing low. The stock is trading beneath the moving-average cluster between 604.55 and 625.81, a bearish structural signal, and the after-hours slide toward 541.60 has already pushed price through the 0.786 retracement at 557.45. A failed bounce into the 557 to 578 gap-fill zone or a confirmed break below 535 would open a path toward the 520.50 swing low and then the 495.00 area, while a reclaim and hold above 590 would shift focus back toward the moving-average cluster near 604 to 626.
Fundamental Driver
The dominant swing factor for the next 24 hours is the market’s digestion of Meta’s Q2 2026 earnings-per-share miss against a revenue beat, together with the raised AI capital-expenditure guidance and a Q3 revenue outlook that landed slightly below consensus, with today’s US GDP and PCE inflation data and the wider Big Tech earnings wave rounding out the backdrop for META.

Frequently Asked Questions About META Today
Quick answers on today’s META technical structure and the next 24 hours
Summary: META Outlook for the Next 24 Hours
META closed the regular session at 585.61, down 1.31% on the day, before a much sharper after-hours slide toward 541.60 following Meta’s Q2 2026 earnings report. The next 24 hours bring a genuinely dense catalyst mix for the stock — the market’s digestion of a revenue beat against an earnings-per-share miss, a raised AI capital-expenditure range of 130 to 145 billion dollars, a Q3 revenue guide slightly below consensus, today’s US Q2 GDP advance estimate and June PCE inflation data, and peer earnings from Apple and Amazon later in the week, any of which is capable of moving META sharply. Traders should watch the 557 to 578 gap-fill zone on any bounce and the 520.50 to 495.00 zone on further weakness as the key levels for the coming session.
This report will be updated as new price action and fundamental developments unfold. For traders looking to act on today’s META setup with flexible leverage and fast execution, Capital Street FX offers the tools to position around fast-moving event-driven sessions like this one.
Explore Capital Street FX